Scoring more goals than the opposition: That is the objective of a football (or soccer, depending on where you are) team in each game. Therefore, the roles and responsibilities of most players can be broken down to a combination of a) scoring goals, and b) stopping goals. Some actions can be directly linked to one of these two objectives. For example, shots, forward passes, crosses, dribbles, etc. are played with an objective of scoring goals whereas blocks, clearances, tackles, etc. are played with an objective of stopping goals. But how about a ball recovery like a tackle or an interception? How about lateral passes and backward passes? The objective of these actions is to either regain possession or to maintain possession. Therefore, this question arises: what is the value of these actions towards scoring or stopping goals? In different words, what is the value of a possession?
To answer this question, we’ll use the data made publicly available by StatsBomb (Thank You, StatsBomb!). This data represents the FIFA World Cup 2018, FA Women’s Super League 2018/19 and NWSL 2018.
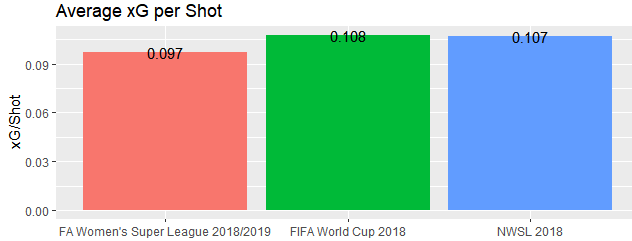
Firstly, let us see what an average shot in each of these tournaments was worth. We’ve already seen that xG is a better measure for predicting goals. Hence, we’ll use xG for this purpose. Image 1 shows the average xG per shot for these three tournaments:

The image shows us that the chances of a shot being turned into a goal range from 9.7% to 10.8%. The three tournaments combined yield 10.4% as the xG/Shot. For purposes of this article, we’ll assume that this is the actual figure.
Next, let us find out what proportion of possessions convert to shots. A little more slicing and dicing tells us that 19.2% of all possessions end in shots. The variation across the three competitions is not too high either. Simple multiplication of these two figures (10.4% * 19.2%) will give us the xG per possession. This equates to 0.0199 goals per possession. So, each time a player loses possession, their team loses roughly 2% of a goal. Also, the opposing teams gains roughly 2% of a goal. So, every possession costs approximately 4% of a goal.


This information could be useful. We can use this to compare players based on their pass success rates. For instance, let us say that player A has a 70% pass success rate. Out of every 100 passes that player A attempts, he/she concedes possession 30 times. He/She costs the team 1.2 (30 * 4%) goals on every 100 pass attempts. Similarly, every interception and/or tackle that wins possession can be considered as a 4% swing in chance of a goal.
Before we get too far ahead of ourselves, let me clarify that this is just a framework that can be used to compare the contribution of the players on all different aspects of the beautiful game of football. In further studies, we can incorporate the position of the ball on the pitch. A ball lost in the defending team’s third might cost more than 4%. Similarly, a ball lost in the midfield that triggers a counter attack for the opposition would be worse than 4%. We can incorporate all of these factors in the form of position on the pitch, players of the defending/attacking team behind/ ahead of the ball, type of possession, etc.
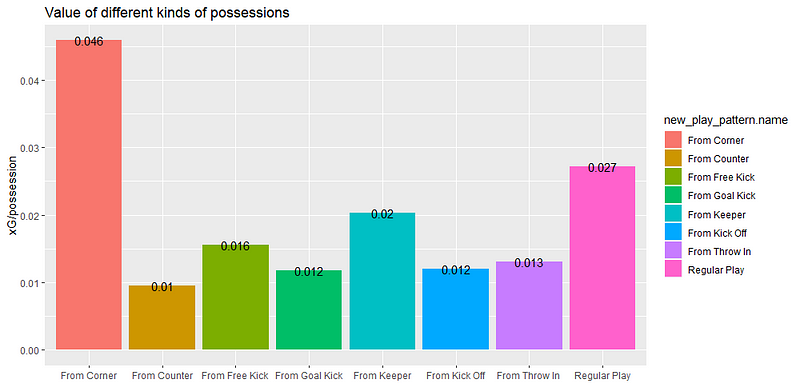
Let us look at image 3 which shows how much the type of possession impacts its value.

This seems counter-intuitive to me. Data suggests that counter-attacks are the least productive attack form. This is inexplicable to me. If anybody has any rationale for why that may be the case, please put it in the comments. Similarly, free kicks are equally productive as regular plays. Of course, a lot of regular plays culminate in free kicks, corner kicks, etc. which are currently included in the regular play section itself. These would be masking the true value of a free kick or a corner.
In my opinion, a framework like this could be most useful in evaluating midfielders. Passes, interceptions, tackles, 50/50 balls, aerial duels, etc. can all be assigned a weightage towards goals. We can incorporate a lot of game context into the framework. The more we add, the better we may become in evaluating players. We may be able to help coaches and players with strategic in-game decisions as well. We can say exactly how effective time wasting near the corner flag towards the end of the game could be. We may also be able to say whether clearances sent out of bounds are better than clearances played down field. We have often seen that offensive players chase over-hit crosses and prevent them from going out for an opposition throw in and instead give it away to the opposition team. If this data is anything to by, coaches should players to not prevent it from going out unless they can retain possession of the ball. Such benefits, although miniscule in nature might add up to create a significant statistical advantage for teams who are interested in analytics.
Originally article published on Medium by Vibhor Agarwal –
Graduate Student, Sports Management at Columbia University


