True Raiding Impact
New Metric for Raider Evaluation – PKL
Author: Vibhor Agarwal

A couple of months ago, we introduced an advanced metric called Net Points per Raid (NPpR) to evaluate raiding performance. We continue our evaluation of raiders through a further enhancement to the concept of NPpR. Here, we shall firstly introduce more complexity in the assessment of raiders and follow it up with a metric which solves for the problem. We will also showcase the results of the enhancement on the Pro Kabaddi League Season 5 data and follow it up with further scopes for improvement.
Just to recap, Net Points per Raid (NPpR) eliminated a fundamental issue with other conventional metrics by penalizing raiders for negative points and also making it easier to compare raiders at the same level. While this improved the assessment of raiders significantly, it does not take into account the situation in which a player went for the raid. The context of the game makes certain raids much easier or harder to score of than certain other raids. There are certain players who go to raids in much tougher situations as compared to certain other raiders. This article is an attempt to level the field for all players regardless of the situation the raider encounters.
Before we go into the metric, let us first use NPpR to check if there are raiding situations which are significantly harder than other situations. We have hypothesized to come up with a lot of situations which could cause the difference:
- Raid number – We expect Do or Die raids to be harder than Raids 1 and 2
- Number of opposition defenders – We expect raiders to have an easier run when 1 or 2 raiders are at the mat. Availability of bonus points might also play in to this
- Match score – We expect defensive teams to take fewer risks when they are leading by a decent margin
- Time left in the game – Towards the end of the game, the match score would dictate the raiding
- Number of players of the raiding team – To get an easy all out, teams give away easy bonus points to the last remaining player on the mat
- Quality of opposition defenders on the mat – We expect defensive units to become significantly less effective when their leading defenders are out of the game
Quality of opposition is hard to quantify. Hence, we will limit ourselves to the first five points on the above list.
Does the raid number impact the NPpR?
The general norm of the PKL has been to save the team’s best raider and to not send him in Do or Die raid situations. To assess if Do or Die raids are actually harder than other raids, we searched our library and pulled up the data for all raids from PKL 5 and computed NPpR values for the raid numbers instead of the players (like we did in the previous article).
Table 1: NPpR values for the raid numbers
Table 1 shows that Raid 1 is the easiest raid to go in and Do or Die raids are the hardest. The overall NPpR value of 0.19 falls to only 0.08 during Do or Die Raids. Unsurprisingly, the raid success rate, which hovers around the 30% mark, actually goes up to 46% during the Do or Die raids. Even then, the penalty for failure on a do or die raid makes it much harder to raid at that time and results in a lower net score.
Let us see if certain raiders have had a higher tendency to raid during do or die raids as compared to others. A positive response to that will conclusively point us towards deciding that raid number is a significant driver for NPpR values.
Overall, only 15% of all raids are do or die raids. We’ll look for raiders who have been to at least 50 raids with more than 25% of those being do or die raids.
Table 2: Specialist Do or Die Raiders
We find seven such raiders. This proves that some raiders are being heavily used as do or die raiders. Mohsen Maghsoudlou of the Telugu Titans has been great at do or die raids. He has a do or die raid NPpR of 0.11 as against the overall Do or Die raid NPpR of 0.02.
Does the number of defenders impact the NPpR?
Raiders are expected to have an easier ride who go into raids when one or two opposing defenders are on the mat. To assess if this is true, we continued with the same data and computed NPpR values for the number of defenders on the mat.
Table 3: NPpR values for the number of opposition defenders during the raid

Table 3 confirms our assumption that raids with 1 or 2 opposition defenders are much easier than others. It also reveals that raids with 5 opposing defenders are the hardest (NPpR = -0.03) to score points off followed by 3 and 4 opposing raiders (0.03).
One might think that bonus points would be the difference between 6 defenders and 5 defenders. But a closer look at the above table shows that the proportion of touch points increases significantly when bonus points are available (0.35 vs 0.20 per raid). It could be because defenders stand a foot or two ahead of their usual stance when bonus points are available, leading to more touch points. Another surprising finding is that the proportion of bonus points earned is higher when 7 defenders are on the mat.
For all those wondering how bonus points are awarded with 5 defenders on the mat, those are cases when one of the defenders was yellow carded and hence, bonus remained available.
Similar to the above analysis, let us see if certain raiders have had a higher tendency to raid when the opposition has had 3, 4 or 5 defenders on the mat. This will be another proof that the situation in which a raider enters a raid is very important to the scoring rates.
Overall, roughly 37% of the raids are when 3 to 5 defenders are on the mat. So, we shall look for raiders who have conducted a minimum of 50 raids with 50% of those coming when there are 3 to 5 defenders on the mat.
Table 4: Raiders with most raids when 3 to 5 defenders on the mat

Table 4 confirms that this is also a valid hypothesis. Some raiders are encountering a lot more tougher situations than others do. We see that five raiders are common among tables 2 and 4. These players are undeniably going for much tougher raids than others.
Does the match score impact the NPpR?
For this, we have defined a metric called ‘point state’. Point state is the difference of the scores of the raiding and the defending team before the raid. For example, when a team which is leading by 1 point goes into a raid, the point state would be +1. If the raider returns empty, the next raid from the opposition will have a point state of -1. Again, we computed the NPpR for the different point states.
Image 1: NPpR values for the point states

The expectation was that NPpRs would be lower for positive point states since teams would take fewer risks. In general, that seems to be true but the difference is not so pronounced. Having said that, there are a few interesting findings. The peaks and troughs on the negative point states are higher while the line is much more stable on the positive point states. This suggests that teams with negative point states are taking much more risks than teams with positive point states. While that is a good finding and a good way to look at it, it doesn’t directly lead to a better assessment of raiders. For that, we would try to club the point state metric with the time of the game to see if this difference becomes more pronounced.
Do time left and match score together impact the NPpR?
For time left, we’ll break the game down into the following phases:

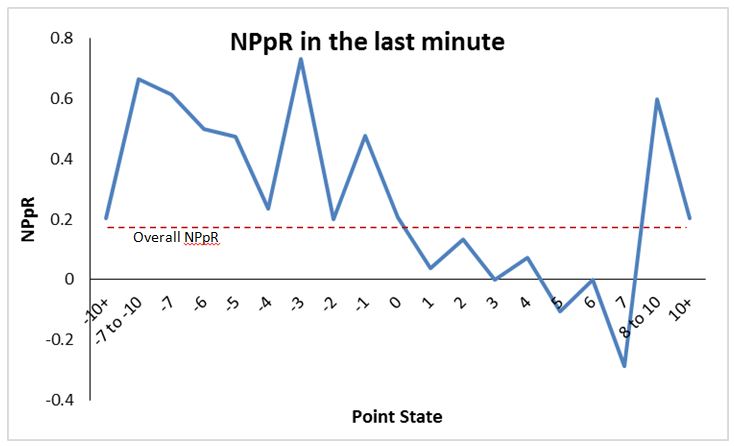
Combining these phases with the point state makes it more interesting. The last minute threw some interesting observations. Let us look at the below chart for a better understanding:
Image 2: NPpR values for the point states in the last minute of the match

We see a steady decline in the NPpR. Clearly, teams which are in the lead don’t do very well in the last minute of the match. Their performance is inversely proportional to the lead they carry. This is legitimate as most teams would be in an early celebratory mode. On the contrary, teams which are in the deficit do significantly better. In fact, they outdo the overall NPpR (0.18) by a significant margin.
Therefore, the point state and the time left in the match, together, shall be used for the raider assessment. This is because it easier for raiders to score in certain match situations than others.
Does the number of raiding team players impact the NPpR?
The number of players on the mat (not only defenders but the attackers as well) could be significant. If the raider is the only attacker on the mat, the defending team is generally willing to give away an easy bonus point without conceding touch points so that they can pin him down during their next attacking raid. Such cases will also bias the NPpR values of the raiders.
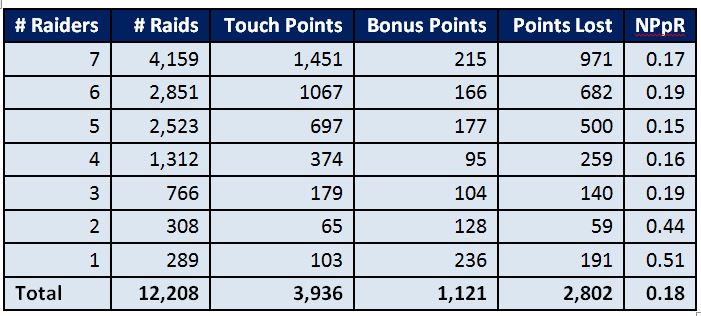
Table 5: NPpR values for the number of raiders

Data seems to validate our hypothesis. Although the NPpR values remain stable near the overall 0.18, they go up drastically (0.44 and 0.51) when only one or two players from the raiding team are on the mat. This is clearly because of the increase in bonus points. Overall, raiders fetch bonus points in 9% of all raids. This number goes up to 42% when two players from the raiding team are on the mat and to as high as 82% when the raider is the only player on the mat.
True Raiding Impact
Now that we know the factors which can be used to quantify the impact the surrounding conditions have on the raid, we shall try to combine all of them to figure out the answers to two questions:
- Which raiders are getting easier raids?
- Which raiders are doing better than others on the tough raids?
Essentially, we shall try to isolate which raiders are actually good and which ones are just ‘appearing’ good (because they go in for easier raids). In other words, we shall try to isolate the impact of the context of the game from the raid.
Using all the findings discussed above, we have created a metric called Expected NPpR (xNPpR). This is similar to the Expected Goals (xG) metric from football. xG uses data of historical shots taken and their success rate to tell us how good a shot was. The higher the xG, the higher was the chance of a goal. It is expected that over time, a team with the higher xG will win more matches. Similarly, xNPpR will tell us the net point expectation for every raid a raider goes into. If a raid has an xNPpR of 0.3, it is expected that an average raider would create a positive 0.3 differential on such a raid. As such, this raid would be considered easy since the overall NPpR is close to 0.18. We can now use the xNPpR metric for every raid to determine which raiders have been given easier raids and which ones have been getting tougher raids. By comparing actual NPpR against the xNPpR, we can also assess the true raiding impact that the raider created. True Raiding impact can also be read as the NPpR over an average player in the league. Let us start to use xNPpR to evaluate all of the above.
Which raider goes for the easier raids?
When a raider goes into a raid 1 with 6 defenders on the mat, 4 to 7 points behind the opposition in the last minute of the match, he is faced with the easiest raid of the game. Such a raid has an xNPpR of 1. This means that an average raider would create a 100 point differential for his team if he goes for 100 such raids.
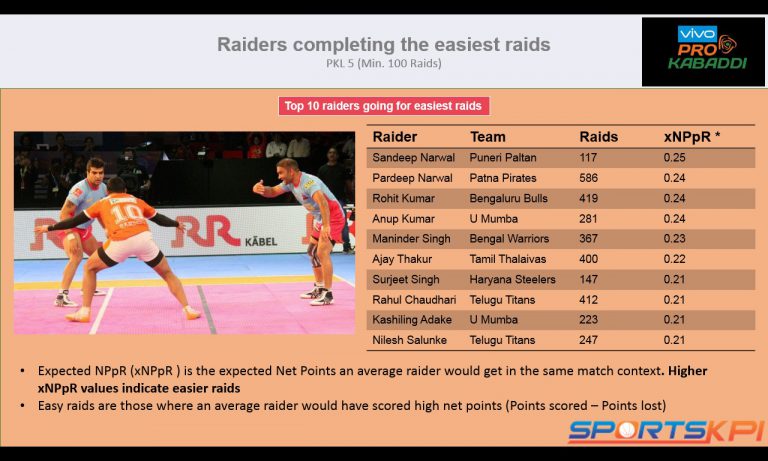
Image 3 shows the list of the top raiders which got the easiest raids during Pro Kabaddi League 5. It uses the average xNPpR for the raider across the season.
Image 3: Using xNPpR values to determine the raiders who are getting an easy ride

That’s a huge surprise. All our usual suspects, the so-called best raiders are also getting the easiest raids in the game. Perhaps this goes on to explain why they are (read ‘appear’) so good. Before we check whether they outdo other raiders in these easy raids, let us also have a quick look at the raiders which get the toughest raids.
Image 4: Using xNPpR values to determine the raiders had their work cut out

Most of the names (4 out of 7) are the same names which rated very low on the list of raiders having least NPpR. This clearly shows that many of the raiders which appear bad are actually not as bad. Their bad raiding appearance might just be a consequence of the match context in which they raid.
Which is the true best raider?
Comparing the actual NPpR and expected NPpR (xNPpR) values reveals the truly best raiders as
True Raiding Impact (TRI) = Actual NPpR – Expected NPpR
True Raiding Impact isolates the match context from the raider’s raids. Since raiders like Tushar Patil who had gone for tougher raids, their expected NPpR values would be low. Their actual NPpR values would also be low. Similarly, for raiders like Sandeep Narwal who had gone for easier raids, the expected NPpR values would be high. Their actual NPpR values would also be high. This way, the difference levels the platform for all raiders. It now allows us to compare the raiders using the True Raiding Impact (TRI).
Image 5: Top performing raiders, according to TRI

Once again, we have a metric which evaluates raiders and proves that Pardeep Narwal is the best in the business. Pardeep has a True Raiding Impact of 0.18. This means that over 100 raids, Pardeep contributes an additional 18 point differential for his team when compared with an average raider. Nitin had an expected NPpR of 0.2, putting him roughly in the middle of the pack. Therefore, Nitin went for the raids similar to an average raider and managed to outscore them by 0.16 points per raid. All players who feature on this list were sold for hefty amounts in the auction. The exceptions to this rule were Pardeep, Sachin and Mahendra who were retained by their respective franchises for much lower amounts. Those retentions are steals given how much their market value could have been.
Let us also quickly look at the worst raiders as well.
Image 6: Bottom performing raiders, according to TRI

The list of the bottom performing raiders has three raiders who had to go for tough raids. They seem to have performed even worse than expected on those raids. This list includes Meraj Sheykh which is a surprise inclusion. Generally perceived as one of the best raiders in the league, Meraj was the leading raider for Dabang Delhi last season. The fact that the Dabang Delhi’s leading raider is on this list also goes to explain their performance in PKL 5. Similar can be said of Surjeet Singh and Jasvir Singh who were the go-to raiders for their teams as well.
In the coming months, we will publish more innovative analyses and insights from the game. Please continue sharing your thoughts and/or suggestions. If you have any PKL related topic you want to read about, please drop a note in the comments section.
All images courtesy www.prokabaddi.com.


